
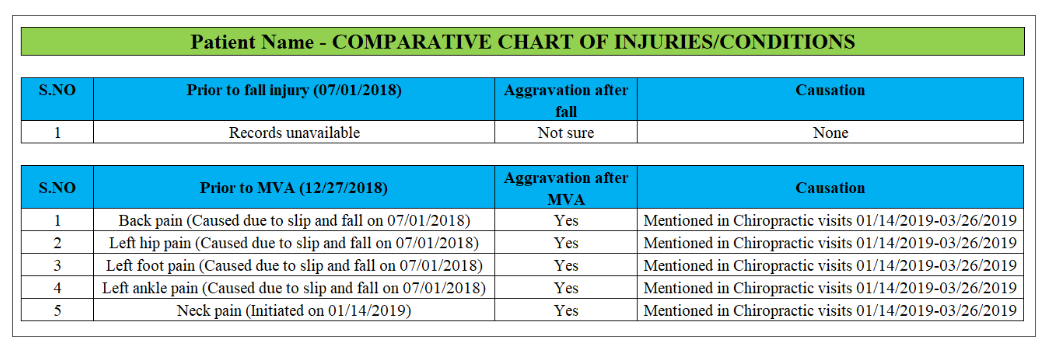
A Comparative Chart presents a side-by-side analysis of a claimant’s medical condition before and after the date of loss. It clearly differentiates prior medical history from accident-related injuries by comparing diagnoses, diagnostic tests, functional status, and treatment details.
This chart is especially useful in cases involving multiple incidents, as it helps isolate injuries attributable to a specific event. By organizing key medical information in a structured, tabular format, the Comparative Chart highlights changes in condition, progression of symptoms, and aggravation of pre-existing conditions.
All relevant medical findings, diagnostic studies, treatment interventions, and functional limitations are presented clearly for easy review, comparison, and legal analysis.
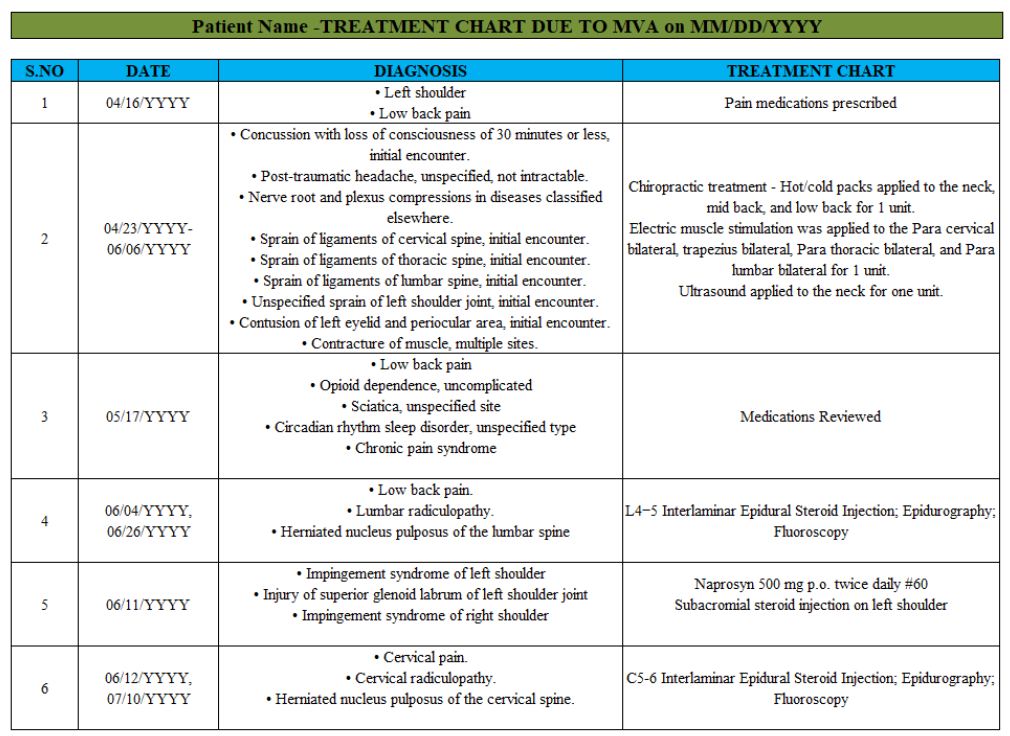
A Treatment Chart presents pain complaints, diagnoses, and treatments in a clear, structured spreadsheet format. Each injury can be tracked separately, allowing for precise review and comparison. Visual elements and progress indicators are included to illustrate treatment progression and response over time.
Our medical professionals prepare customized medico-legal reports based on case-specific requirements. These reports clearly outline medical facts related to injuries, treatment, and associated pain and suffering, supporting effective legal analysis and presentation.
Specialized report formats include:
Comparative Chart
Treatment Chart
Pain & Suffering Chart
Pain & Medication Graph
Accident Timeline
List of Injuries
Pre-Existing Injuries
Pain Score Chart
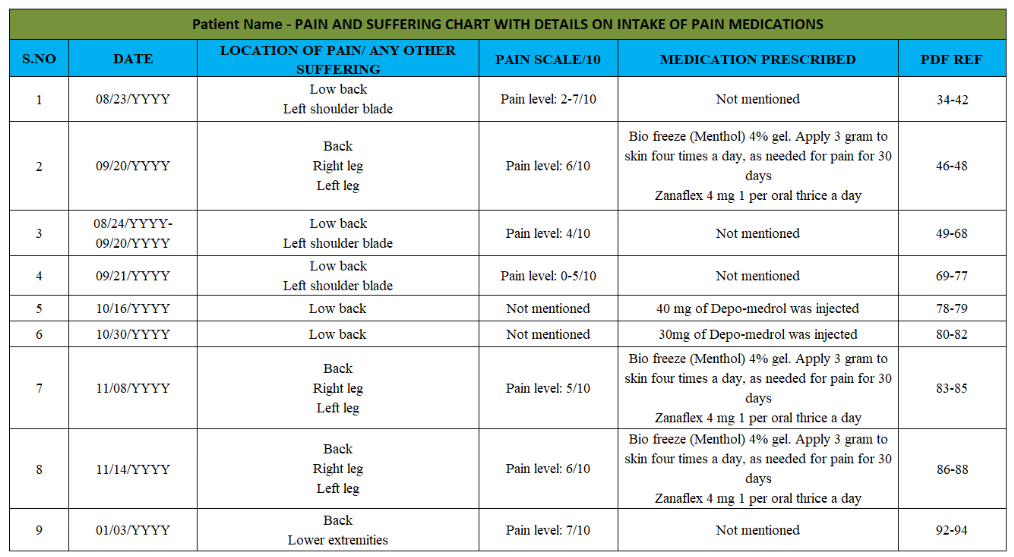
A Pain & Suffering Chart provides a structured, chronological overview of the claimant’s pain experience and treatment journey. The chart captures essential details such as date of service, treating or prescribing provider, chief complaints, pain location, pain scale, prescribed medications, assessment and plan, prognosis, along with precise PDF or Bates references for verification.
Pain levels, subjective complaints, medications, treatments rendered, and progress in pain relief are presented in a clear tabular format. The chart also documents physical therapy sessions and outcomes, pain management consultations, interventional procedures such as injections, and the claimant’s response and progress over time.
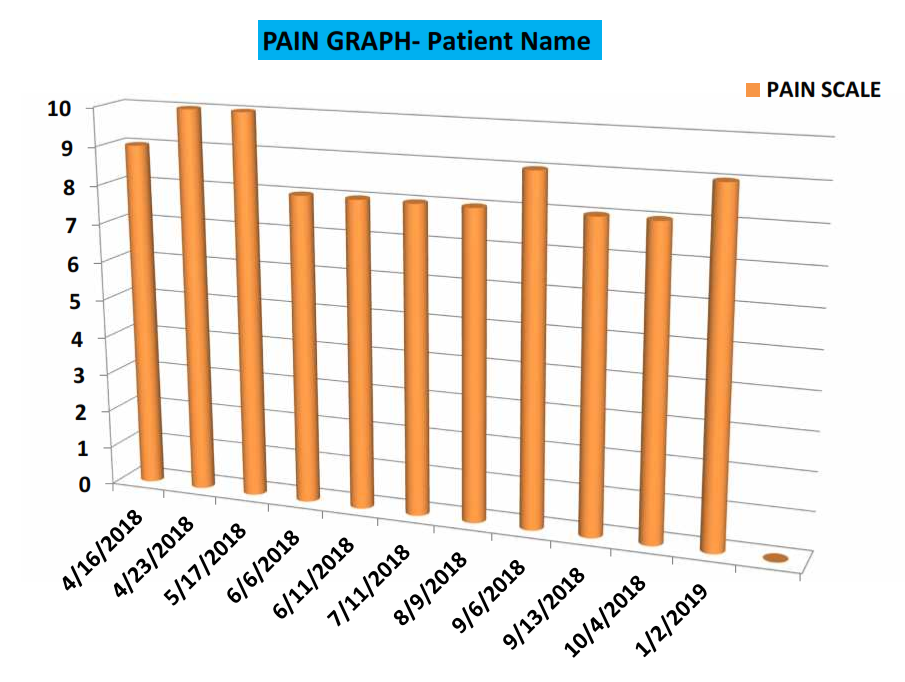
Pain & Medication Graphs and Charts visually correlate reported pain levels with prescribed medications over time, clearly illustrating treatment intensity and injury impact.
Using verified pharmacy records, these charts capture medication type, dosage, refill history, and duration, translating complex data into easy-to-read visual formats.
Key Benefits
Demonstrates pain progression and treatment patterns
Supports assessment of injury severity and suffering
Identifies prolonged use or potential medication overuse
Strengthens case presentation with clear visual evidence
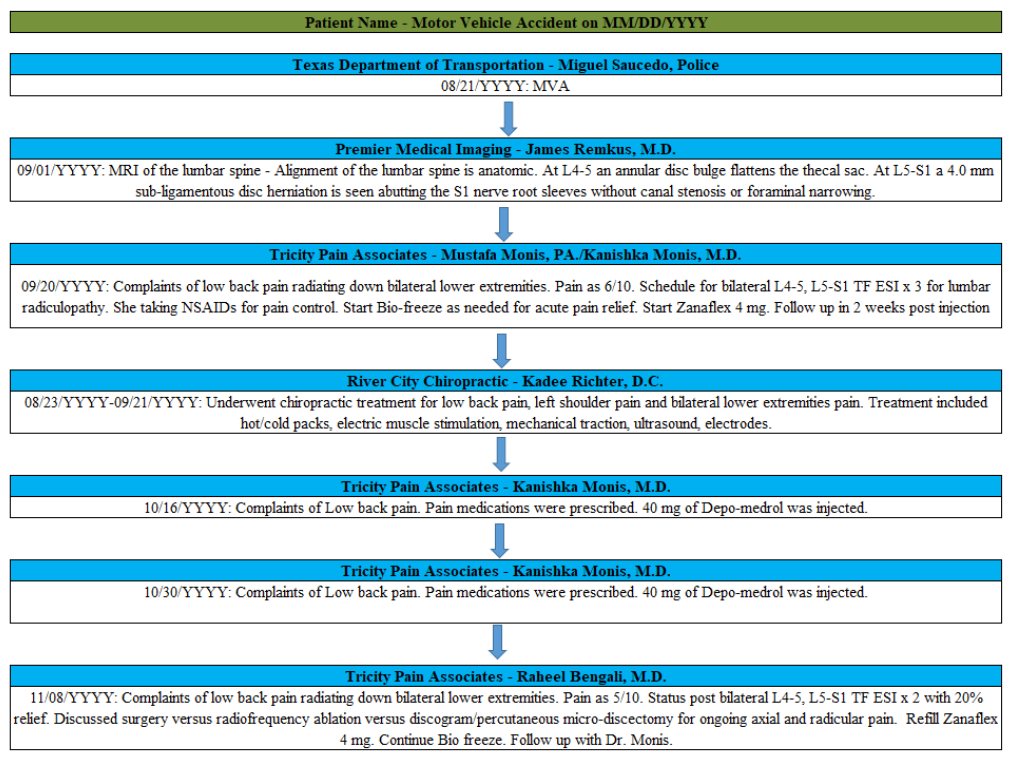
An Accident Timeline presents a clear, chronological view of events following an incident, linking injuries, treatments, and outcomes in an easy-to-follow sequence. It helps legal teams quickly understand how the injury progressed and how medical care evolved over time.
Our medical experts create customized reports tailored to specific case requirements, clearly outlining medical facts related to injuries and resulting pain and suffering.
Custom Reports May Include
Comparative Charts
Treatment Charts
Pain & Suffering Charts
Pain & Medication Graphs
Accident Timelines
Lists of Injuries
Pre-existing Conditions
Pain Score Charts
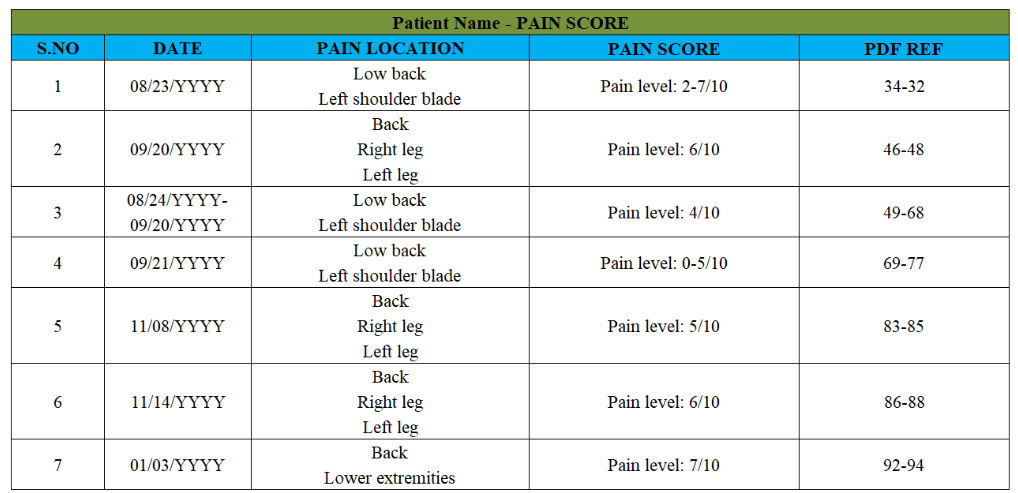
A Pain Score Chart provides a structured, visual representation of a claimant’s pain levels over time. By mapping reported pain scores alongside treatments and clinical milestones, it helps legal teams clearly assess the intensity, duration, and progression of pain following an injury.
Our medical experts prepare customized reports based on specific case requirements, accurately outlining medical facts related to injuries and resulting pain and suffering in a clear, easy-to-review format.
Custom Reports May Include
Comparative Charts
Treatment Charts
Pain & Suffering Charts
Pain & Medication Graphs
Accident Timelines
Lists of Injuries
Pre-existing Conditions
Pain Score Charts
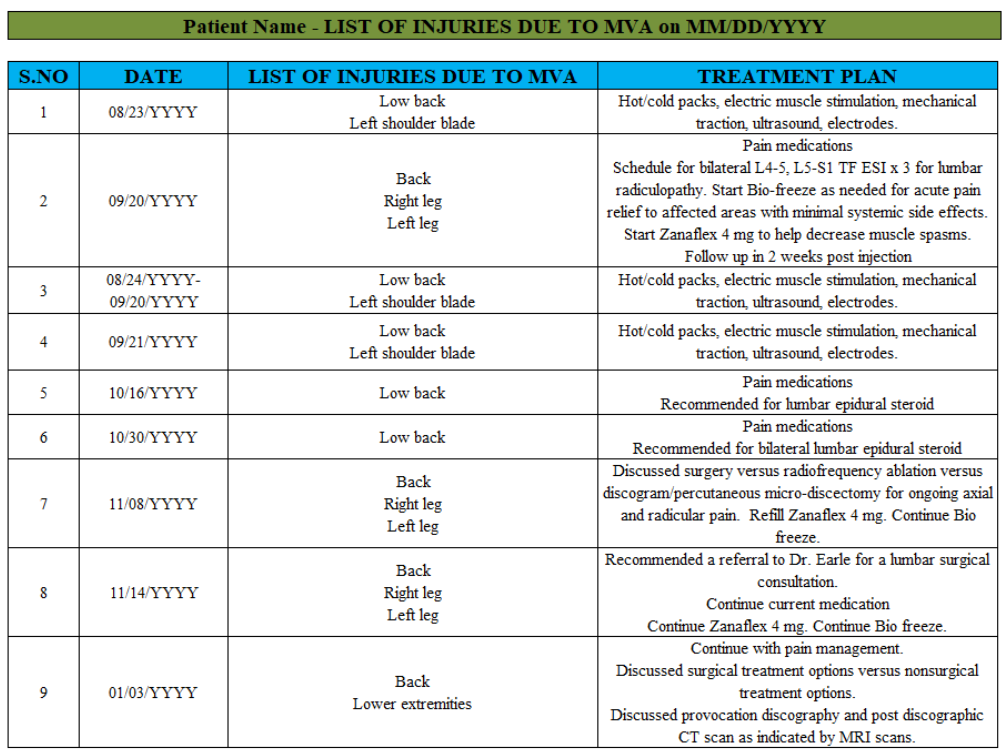
A List of Injuries provides a clear, organized summary of all injuries sustained by the claimant, helping legal professionals quickly identify the scope and severity of harm. Each injury is documented based on medical records, ensuring accuracy, consistency, and ease of reference during case evaluation.
Our medical experts prepare customized reports tailored to specific case requirements, clearly outlining medical facts related to injuries and the resulting pain and suffering in a structured, attorney-friendly format.
Custom Reports May Include
Comparative Charts
Treatment Charts
Pain & Suffering Charts
Pain & Medication Graphs
Accident Timelines
Lists of Injuries
Pre-existing Conditions
Pain Score Charts
Es gibt Tage, an denen du einfach nicht weißt, wohin der Weg führt. Du gehst zum Arzt, weil du einen stechenden Schmerz spürst – nicht dramatisch, aber auch nicht ganz unbedeutend. Du hoffst, dass alles in Ordnung ist. Ehrlich gesagt, manchmal fühlt sich der Besuch wie ein Glücksspiel an. Eine Wette auf das, was der Arzt dir sagen wird. Und mal unter uns – wer schon mal bei einem Slot-Spiel auf „Spin“ gedrückt hat, weiß, wie sich dieser Moment anfühlt. Man wartet, hofft und hält den Atem an. Vielleicht ist es einfach der gleiche Nervenkitzel, den wir auch bei einem spannenden Match oder einer Sportwette erleben, oder bei einem aufregenden Online-Roulette.
Du setzt deine Gesundheit auf die Karte des Vertrauens – in den Arzt, in die Klinik, in die Behandlung. Und was ist mit den Ergebnissen? Wer weiß das schon. Genau wie bei einem Glücksspiel. Ob bei einer Fußballwette, einem aufregenden Lottospiel oder einer Runde Blackjack. Du wirst nie wissen, was passiert, aber du gehst das Risiko ein, weil du auf das Beste hoffst. Und mal ehrlich – auch die besten Ärzte können nicht garantieren, dass alles glatt läuft. Aber wir probieren es trotzdem. Genauso wie bei Sultanbet Sportwetten. Manchmal gewinnst du, manchmal verlierst du. Aber der Adrenalinkick, der dabei entsteht, das Gefühl, lebendig zu sein – das ist doch etwas, das uns immer wieder antreibt.
Was mich an dieser Parallele zwischen Gesundheit und Glücksspielen immer wieder fasziniert, ist die menschliche Psyche. Warum setzen wir uns ständig Risiken aus, obwohl wir wissen, dass der Ausgang ungewiss ist? Bei der Medizin ist es oft Vertrauen. Bei den Spielen geht es um den Nervenkitzel, das Abenteuer, das Unvorhersehbare. Und doch spielen beide in unserem Leben eine Rolle. Wir setzen, wir hoffen, und manchmal gewinnen wir – sei es durch die richtige Therapie oder durch einen zufälligen Glückstreffer im Spiel. Vielleicht ist es genau diese Unsicherheit, die das Leben so spannend macht. Und genau wie beim Betten auf Sportereignisse oder Online-Slots bleibt uns nur, abzuwarten, was passiert. Mal sehen, ob unser „Spin“ im Leben der richtige ist!
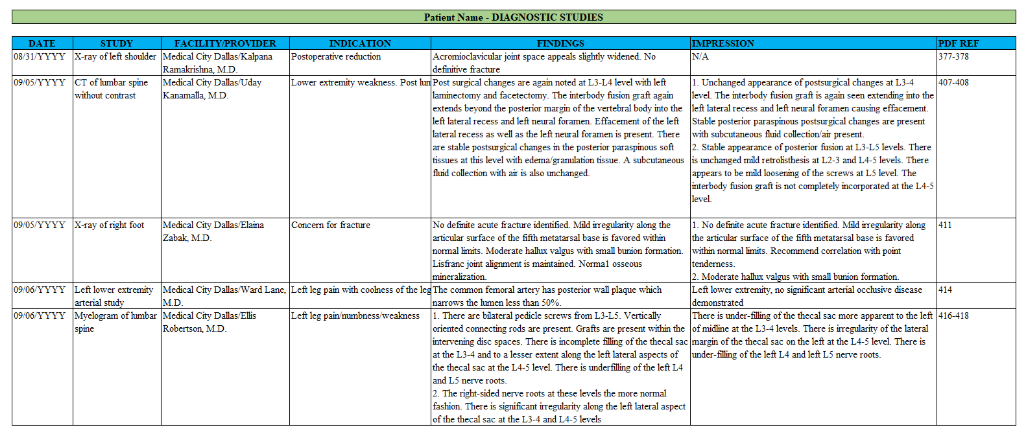
A Diagnostic Studies Chart presents a clear comparison of all diagnostic tests conducted before and after the date of loss, focusing specifically on studies relevant to the claimed injuries. This chart helps legal professionals identify changes, new findings, and injury progression through objective medical evidence.
Our medical experts prepare customized reports based on case-specific requirements, clearly outlining diagnostic findings that support injury evaluation and pain-and-suffering analysis in a structured, easy-to-review format.
Custom Reports May Include
Comparative Charts
Treatment Charts
Pain & Suffering Charts
Pain & Medication Graphs
Accident Timelines
Lists of Injuries
Pre-existing Conditions
Pain Score Charts